Work with tables
You can add tables to your diagram by inserting one of the table shapes from the Tables shape library. A table can include a maximum of 10 rows and 13 columns.
-
In your diagram, from the Tables shape library, drag and drop the appropriate table shape to your diagram.
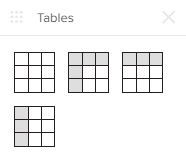 If you do not see this shape library, you can instead search for tables or add the lilbrary (see View more shape libraries) from the Website and UI category.
 -
To add text, double-click a table cell and start typing.
-
To add or remove columns or rows, click the table shape and click the Edit custom properties
 button. Then, from the table properties pane, click the appropriate button.
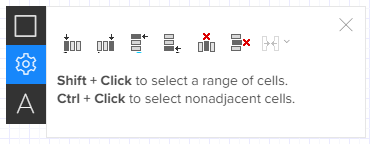
-
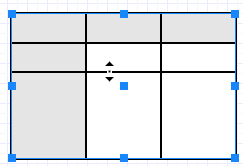
To select multiple cells, Shift+click to select a range of cells or Ctrl+click to select non-adjacent cells. Selected cells are highlighted in blue.
-
Format the table shape, selected cells, or text, as desired. For more information, see Format shapes and Format text.
The X,Y coordinates and the width/height control the entire table, not an individual cell -
To adjust the width and height of individual columns or rows, hover your cursor over a border line and then click and drag to the appropriate size.